 THE FACT THAT THEY WON'T RELEASE THEIR TAX RETURNS
makes this question all the more pertinent
THE FACT THAT THEY WON'T RELEASE THEIR TAX RETURNS
makes this question all the more pertinent
Thursday, March 06, 2008
THE BILLERIES' METEORIC RISE IN WEALTH
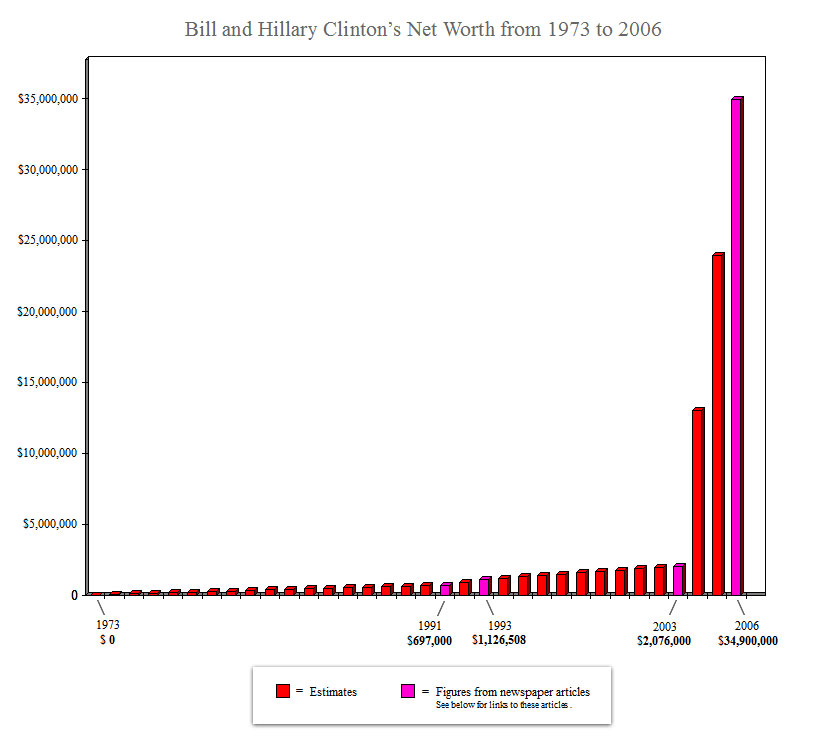
Bill and Hillary Clinton's Recent Meteoric Rise in Wealth (Graphs, Links, and Thoughts)
Since they first entered politics back in mid 1970s until as recently as 2003, the Clintons maintained a relativly modest level of net wealth. Even in the three years following Bill Clinton’s presidency their combined net worth remained surprising low - with much of Hillary’s $8 million book deal and other earnings getting eaten up by outstanding legal fees associated with numerous investigations during the presidential years.
So what exactly happened between 2004 and the present that explains the Clinton's meteoric growth in person wealth? The conventional wisdom is that Bill Clinton’s new career giving speeches explains the sudden increase.
If this is true, how and why did the speaking circuit proved so much more lucrative in the three years between 2004 and 2006 than it did in the three years between 2001 and 2003?
Just how is it that the three years of speaking gigs before January 1, 2004 had little effect on the Clinton’s net wealth while the three years of speaking gigs after January 1, 2004 caused it to multiply by more that 15 times?
Perhaps there is a perfectly reasonable explanation for all this but I think the subject certainly merits some more scrutiny by the press, if for no other reason than confirm or put to rest Dick Morris’s conspiracy theories.
The links under the graphs below show that the MSM is starting to take a closer look at Bill Clinton’s recent business activities.
However, the question of how, or if, these activities have contributed to the Clinton's post-2003 exponential growth in wealth still remains unanswered. The fact that the Clinton campagn is now starting to tap into this recently-created fortune, and... Two Graphs Feel free to copy them, display them on your site, distribute, alter, etc. (ie- "do with them what thou wilt") 1973 = $ 0
This is the year the Clintons both graduated from law school at Yale and I’m assuming their net assets were 0.
If you'd like to quibble and claim it's wrong to assume this - that perhaps they had managed to save up $2,000 - $30,000 dollars during their summer breaks, that's fine with me. Look at that left-most red dot and imagine it being a tenth of a millimeter higher than it is now, because that's how much differnce it would make.
1991 = $ 697,000 Got figure from... http://money.cnn.com/magazines/moneymag/moneymag_archive/1992/07/01/87389/index.htm
1993 = $ 1,126,508 (I used the midpoint of the reported range of $633,015 - $1,620,000) Got figure from... http://query.nytimes.com/gst/fullpage.html?res=950DE4DB1438F93BA25756C0A962958260
2003 = $2,076,000 (I used the midpoint of the reported range of $352,000 to $3,800,000) Got figure from...
http://www.cnn.com/2003/ALLPOLITICS/06/13/senators.finances/
2006 = $34,900,000 Got figure from...
http://money.cnn.com/galleries/2007/moneymag/0712/gallery.candidates.moneymag/index.html
I used these years because they were the only ones I could find definite numbers for. If you find articles with other nailed-down figures for years estimated above send me the link. If I get several more figures I'll plug them into the graph.
But keep in mind, IT'S NOT GOING TO MAKE A BIT OF DIFFERENCE visually.
I sincerely doubt any new numbers will deviate enough from my estimates to change the basic look and feel of the graph. I have read in several places that the Clinton's were almost broke in the late 90s due to legal bills so if anything the post-1992, pre-2003 numbers might be a bit lower than my estimates.
But again, adjusting for this would have little impact on the graph and if anything make the "J" curve at the end of the timeline all the more dramatic.
Where I Got the FiguresShareSave This Page Stumble It!
THE FACT THAT THEY WON'T RELEASE THEIR TAX RETURNS
makes this question all the more pertinent
THE FACT THAT THEY WON'T RELEASE THEIR TAX RETURNS
makes this question all the more pertinent
Subscribe to:
Post Comments (Atom)


No comments:
Post a Comment